BOX=Yes
BOX=Yes
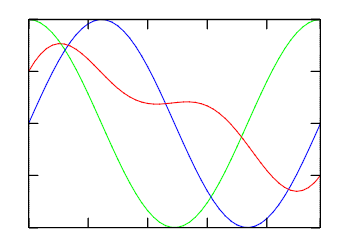
Draws lines between points. DS_COLOR, DS_LINESTYLE and DS_LINEWIDTH are used to configure the lines.
|
(3 plots) BOX=Yes |
|
ROTATE=40:0:60 BOX=Yes |
Draws a mark in each point. DS_COLOR, DS_MARKSTYLE and DS_MARKSIZE are used to configure the marks.
Draws lines between points and draws a mark in each point. Same as if LINE and MARK where set together.
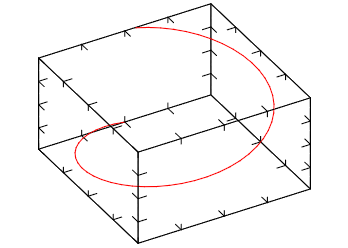
Draws a radar chart. Like a LINE plot in polar coordinates. RADARSHIFT configures an additional radial shift of the data [If rs<0 then rs=max(0, -min(a))], default=-1. If DATAGRID=Yes then a grid of radial lines and a circle for rs are drawn. DS_COLOR, DS_LINESTYLE and DS_LINEWIDTH are used to configure the lines. DS_COLOR, DS_MARKSTYLE and DS_MARKSIZE are used to configure the marks.
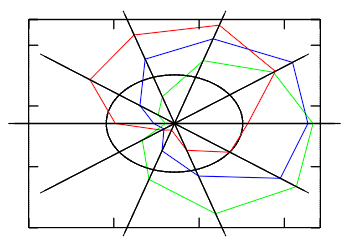 |
(3 plots) RADARSHIFT=0.4 DATAGRID=Yes BOX=Yes |
Draws lines between points and fills it to axis plane. DS_COLOR is used to configure fill color. The order of the datasets will define which one will be drawn first.
 |
(3 plots) AXS_XORIGIN=0 AXS_YORIGIN=0 BOX=Yes |
Draws vertical bars from points to axis plane. If DATAGRID=Yes then grid lines are drawn, default=No. BARWIDTH sets relative width of rectangles, default=0.7.
 |
AXS_XORIGIN=0 AXS_YORIGIN=0 BOX=Yes |
 |
ROTATE=40:0:60 BOX=Yes |
Draws horizontal bars from points to axis plane. If DATAGRID=Yes then grid lines are drawn, default=No. BARWIDTH sets relative width of rectangles, default=0.7.
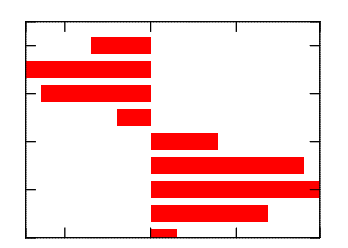 |
AXS_XORIGIN=0 AXS_YORIGIN=0 BOX=Yes |
Draws colored stripes (boxes). If DATAGRID=Yes then black border lines are drawn, default=No. If PIECHART=Yes cylindrical coordinates are used, default=No.
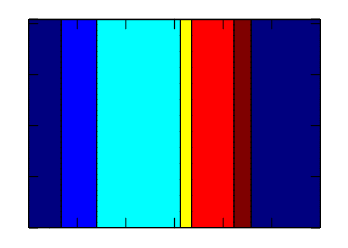 |
DATAGRID=Yes BOX=Yes |
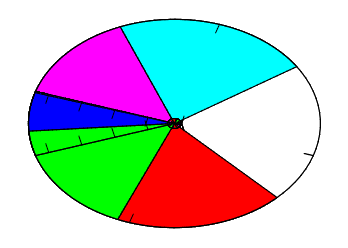 |
DATAGRID=Yes BOX=Yes PIECHART=Yes COLORSCHEME=bgr cmy |
Draws continuous stairs for points to axis plane. DS_COLOR, DS_LINESTYLE and DS_LINEWIDTH are used to configure the lines. DS_COLOR, DS_MARKSTYLE and DS_MARKSIZE are used to configure the marks.
 |
(3 plots) BOX=Yes |
Draws vertical lines from points to axis plane. DS_COLOR, DS_LINESTYLE and DS_LINEWIDTH are used to configure the lines. DS_COLOR, DS_MARKSTYLE and DS_MARKSIZE are used to configure the marks.
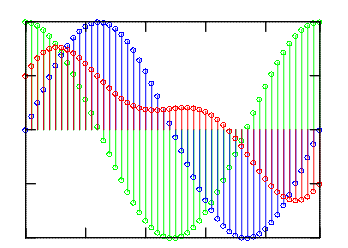 |
(3 plots) DS_MARKSTYLE=HOLLOW_CIRCLE DS_SHOWMARKS=Yes AXS_XORIGIN=0 AXS_YORIGIN=0 BOX=Yes |
Draws arbitrary placed points. Colors will be used from the previous color scheme or from COLORSCHEME if defined.
 |
ROTATE=40:0:60 BOX=Yes TRANSPARENT=No LIGHT=Yes |
This will reconstruct and draw the surface for arbitrary placed points. If DATAGRID=Yes then wire plot is produced, default=No. Colors will be used from the previous color scheme or from COLORSCHEME if defined.
 |
ROTATE=40:0:60 BOX=Yes TRANSPARENT=No LIGHT=Yes |
For all planar modes colors will be used from the previous color scheme or from COLORSCHEME if defined. COLORSCHEME is a string that can specify a group of colors to be used by the plot.
Colors in a color scheme are specified by the codes "wkrgbcymhRGBCYMHWlenupqLENUPQ" only. A brightness weight from 1 to 9 can also be used to change the default value from 5 normal, to 1 very dark, and to 9 very bright.
Also the symbol ‘d’ denotes the interpolation by 3D position instead of the coloring by amplitude. Symbol ‘|’ disables color interpolation in color scheme, which can be useful, for example, for sharp colors during matrix plotting.
For coloring by amplitude (most common) the final color is a linear interpolation of color array. The color array is constructed from the string ids. The argument is the amplitude normalized based on COLORBARRANGE. When coloring by coordinate, the final color is determined by the position of the point in 3D space and is calculated from combining the first three elements of color array with the x, y and z normalizes values. This type of coloring is useful for isosurface plot where color may show the exact position of a piece of surface.
Here are some examples or color codes and color schemes:


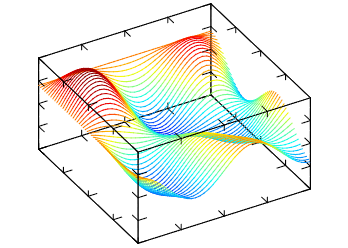
Draws mesh lines for the surface. Mesh lines are plotted for each z slice of the data. DS_LINESTYLE and DS_LINEWIDTH are used to configure the lines.
 |
ROTATE=40:0:60 BOX=Yes TRANSPARENT=No LIGHT=Yes |
Draws fall lines for the surface. DS_LINESTYLE and DS_LINEWIDTH are used to configure the lines. If DIR=X, then lines are drawn along x-direction else lines are drawn along y-direction, default=Y.
 |
ROTATE=40:0:60 BOX=Yes TRANSPARENT=No LIGHT=Yes |
Draws belts for the surface. If DIR=X, then lines are drawn along x-direction else lines are drawn along y-direction, default=Y.
 |
ROTATE=40:0:60 BOX=Yes TRANSPARENT=No LIGHT=Yes |
Draws the surface. If DATAGRID=Yes then grid lines are drawn, default=No.
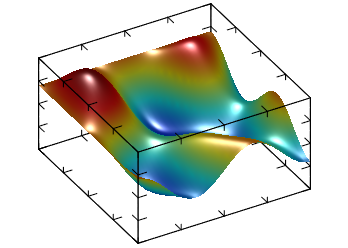 |
ROTATE=40:0:60 BOX=Yes TRANSPARENT=No LIGHT=Yes |
 |
ROTATE=40:0:60 BOX=Yes TRANSPARENT=No LIGHT=Yes COLORSCHEME=BbcyrR| |
Draws vertical boxes for the surface. If DATAGRID=Yes then box lines are drawn, default=No.
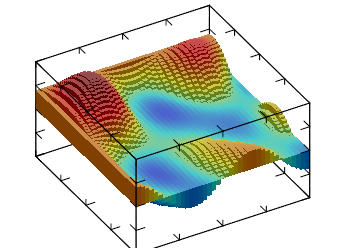 |
ROTATE=40:0:60 BOX=Yes TRANSPARENT=No LIGHT=Yes AXS_XORIGIN=0 AXS_YORIGIN=0 AXS_ZORIGIN=0 |
Draws horizontal tiles for the surface, it can be seen as 3D generalization of STEP.
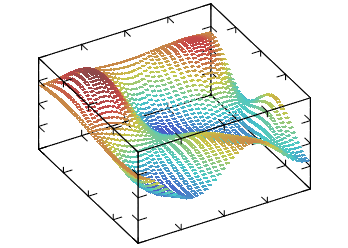 |
ROTATE=40:0:60 BOX=Yes TRANSPARENT=No LIGHT=Yes |
Draws density plot for the surface at minimum z coordinate.
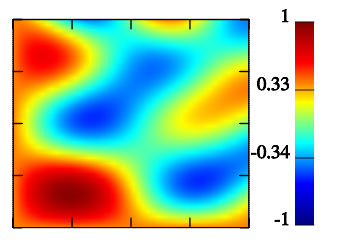 |
BOX=Yes TRANSPARENT=No COLORBAR=Yes |
Draws contour lines for the surface at the minimum z coordinate. CONTOURCOUNT defines the number of contour lines, default=7. If CONTOURFILLED=Yes draws solid (or filled) contour lines for the surface, default=No. If CONTOURLABELS is defined then contour labels will be drawn BELLOW or ABOVE the contours.
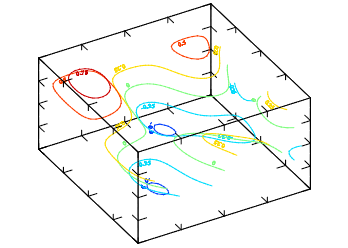 |
ROTATE=40:0:60 BOX=Yes TRANSPARENT=No LIGHT=Yes CONTOURLABELS=BELLOW |
 |
ROTATE=40:0:60 BOX=Yes TRANSPARENT=No LIGHT=Yes CONTOURFILLED=Yes |
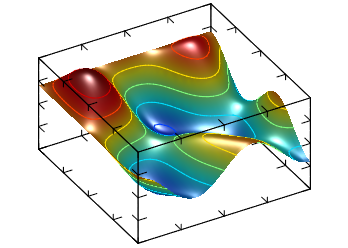 |
ROTATE=40:0:60 BOX=Yes TRANSPARENT=No LIGHT=Yes (dual plot) DS_MODE=PLANAR_SURFACE DS_MODE=PLANAR_CONTOUR |
Draws a surface which is result of the contour plot rotation for the surface. AXIALCOUNT defines the number of elements distributed in the COLORBARRANGE interval, default=3.
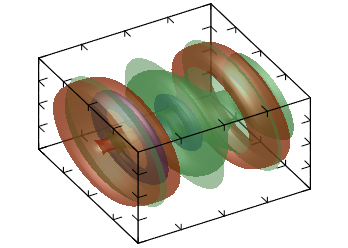 |
ROTATE=40:0:60 BOX=Yes TRANSPARENT=Yes LIGHT=Yes |
Draws gradient lines for scalar field defined by the surface at minimum z coordinate. Number of lines is proportional to GRADLINESCOUNT, default=5 . If GRADLINESCOUNT<0 then lines start from borders only. Lines are plotted for each z slice of the data.
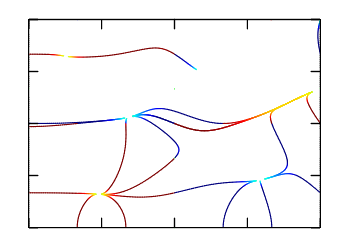 |
BOX=Yes TRANSPARENT=Yes LIGHT=Yes |
 |
BOX=Yes TRANSPARENT=Yes LIGHT=Yes (dual plot) DS_MODE=PLANAR_GRADIENTLINES DS_MODE=PLANAR_DENSITY |
For all volumetric modes colors will be used from the previous color scheme or from COLORSCHEME if defined.
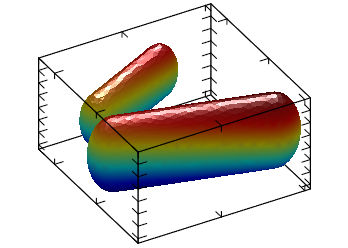
Draws isosurface plot for the volume. If DATAGRID=Yes then wire plot is produced, default=No. if ISOVALUE is defined only 1 isosurface is plot, else ISOCOUNT (default=3) surfaces are plot distributed in the COLORBARRANGE interval.
Note, that there is possibility of incorrect plotting due to uncertainty of cross-section defining if there are two or more isosurface intersections inside one cell.
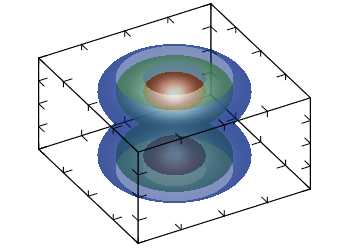 |
ROTATE=40:0:60 BOX=Yes TRANSPARENT=Yes LIGHT=Yes |
Draws density plot for the volume. If DATAGRID=Yes then grid lines are drawn, default=No. If PROJECT=Yes draws density plot in x, y, or z plain, default=No. When PROJECT=Yes, PROJECTVALUEX, PROJECTVALUEY and PROJECTVALUEZ, are used to select data at the given coordinate, if they are not defined AXS_?ORIGIN is used accordingly. When PROJECT=No, SLICEX, SLICEY and SLICEZ, are used to define the slice where the plot is done, default is -1 (central). SLICEDIR defines which directions are used, default "XYZ".
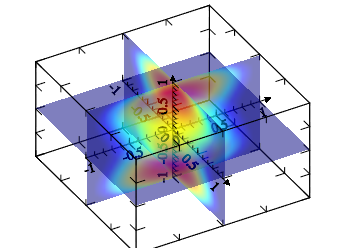 |
ROTATE=40:0:60 BOX=Yes TRANSPARENT=Yes LIGHT=No AXS_XORIGIN=0 AXS_YORIGIN=0 AXS_ZORIGIN=0 AXS_X=Yes AXS_Y=Yes AXS_Z=Yes |
 |
ROTATE=40:0:60 BOX=Yes TRANSPARENT=No LIGHT=No PROJECT=Yes PROJECTVALUEX=-1 PROJECTVALUEY=1 PROJECTVALUEZ=-1 |
Draws contour plot for the volume. If DATAGRID=Yes then grid lines are drawn, default=No. If PROJECT=Yes draws contour plot in x, y, or z plain, default=No. When PROJECT=Yes, PROJECTVALUEX, PROJECTVALUEY and PROJECTVALUEZ, are used to select data at the given coordinate, if they are not defined AXS_?ORIGIN is used accordingly. When PROJECT=No, SLICEX, SLICEY and SLICEZ, are used to define the slice where the plot is done, default is -1 (central). SLICEDIR defines which directions are used, default "XYZ". If CONTOURFILLED=Yes draws solid (or filled) contour lines for the surface, default=No. CONTOURCOUNT defines the number of contour lines, default=7. Where lines are used, DS_LINESTYLE and DS_LINEWIDTH are used to configure the lines.
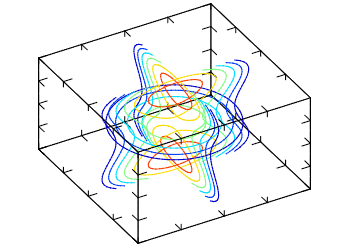 |
ROTATE=40:0:60 BOX=Yes TRANSPARENT=No LIGHT=Yes |
 |
ROTATE=40:0:60 BOX=Yes TRANSPARENT=No LIGHT=Yes PROJECT=Yes PROJECTVALUEX=-1 PROJECTVALUEY=1 PROJECTVALUEZ=-1 |
 |
ROTATE=40:0:60 BOX=Yes TRANSPARENT=No LIGHT=Yes |
 |
ROTATE=40:0:60 BOX=Yes TRANSPARENT=No LIGHT=Yes PROJECT=Yes PROJECTVALUEX=-1 PROJECTVALUEY=1 PROJECTVALUEZ=-1 CONTOURFILLED=Yes |
Draws cloud plot for the volume. This plot is a set of cubes with color and transparency proportional to value of ALPHA. The resulting plot is like cloud – low value is transparent but higher ones are not. If CLOUDLOW=Yes then lower quality plot will be produced with much low memory usage.
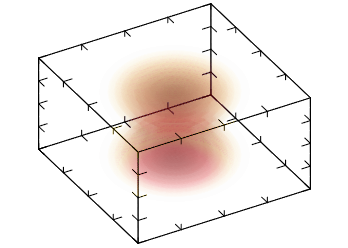 |
ROTATE=40:0:60 BOX=Yes TRANSPARENT=Yes LIGHT=No COLORSCHEME=wyrRk |